Sr. Lean Certification Project

Bernard Sefogah
Sr. Lean Certification Project
Date: 24th April, 2020
Company Name: Integer Holding Corporation Plymouth Applicant(s): Bernard Kwabena Sefogah
The Project Name: Plymouth XXX Value Stream Lean Diagnosis
Champion: Snr Engineering Manager
Project Leader: Bernard Sefogah (Snr Industrial Engineer)
Team Members: Engineering Manager, Manufacturing Engineer, Planner, Snr Operations Manager & Operations & Customer Success Rep, Production Supervisor, Team Lead, and Manufacturing Team members, Quality Engineer.
The Company Description:
Integer Holdings Corporation (NYSE:ITGR) is one of the largest medical device outsource (MDO) manufacturers in the world serving the cardiac, neuromodulation, vascular and portable medical markets. The company provides innovative, high-quality technologies and manufacturing to Medical Device OEM’s to enhance the lives of patients worldwide. In addition, it develops batteries for high-end niche applications in energy, military, and environmental markets. GreatbatchTM Medical, Lake Region MedicalTM and ElectrochemTM comprise the company’s brands.
Problem Statement:
Pockets of improvements are going on the Plymouth XXX Value Stream. These improvements are not prioritized or integrated. Demand is very likely to increase (double to 400-500K units). The manufacturing cost per is about $3 -$5 higher than that of our competitor. Determine the critical symptoms that impact production cost (UPLH) and profitability of XXX products and implement projects to address them by end of December 2020.
Assessment:
This project was chosen based on Revenue impact and new business opportunity for the value stream. All value stream at the site were ranked in terms of their contribution to site revenue.
Timeline:
- Complete Lean Diagnosis of Value Stream by end Q1 (Deliverable from the diagnosis will be a priority list of projects to be undertaken to improve UPLH from 15.3 to 18.6
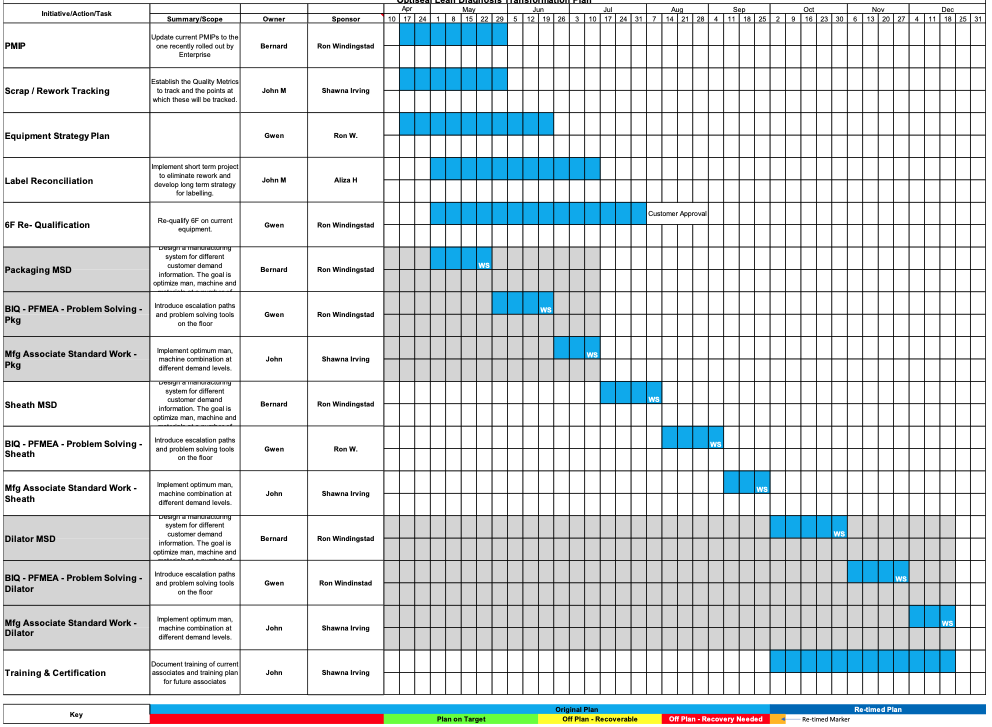
- Complete Phase 1 Projects (PMIP, Scrap/Rework Tracking, Pkg. MSD, BIQ-Pkg and Equipment Strategy Plan) by end of Q2
- Complete Phase 2 Projects (Label Reconciliation, 6FR Re-Qualification, BIQ – Pkg., Standard Work – Pkg., Sheath MSD, BIQ – Sheath) by
end of Q3
- Complete Phase 3 Projects (Dilator MSD, BIQ – Dilators, Standard Work – Dilators, Training & Certification) by end of Q4
Lean Tools & Templates Used
Connection mapping (Material and Information flow mapping) Lead time analysis
Input-Output analysis
Video and Gemba (Process analysis)
Cross-functional team engagement (floor exercises and team discoveries)
Current State:
(Describe current conditions, starting point, challenges anticipated, etc.)
XXX Value Stream Field Customer Complaint rate is Y% for the past 12 months XXX Value Stream Internal Non-conformance rate is Z% for the past 12 months Internal Rework is not quantified and made visible
On-Time-Delivery to customer request was 85% in 2019
Associate utilization is 40 – 50%
Line balance is 63 – 77%
Goals:
The goals we planned to achieve included:
- To determine the critical symptoms that impact production cost (UPLH) and profitability of XXX products
Initiate projects to increase XXX value stream UPLH from 15.3 to 18.6 by the end of Q4 of 2020
Major Project Activities and Challenges:
(Bulleted list or sub headers of major actions done toward the initiative)
|
Required Pre- Diagnosis Work (Dec.`19 through Mar `20) |
Draft Project Profile (Charter) |
|
Diagnosis (7th through 9th April) |
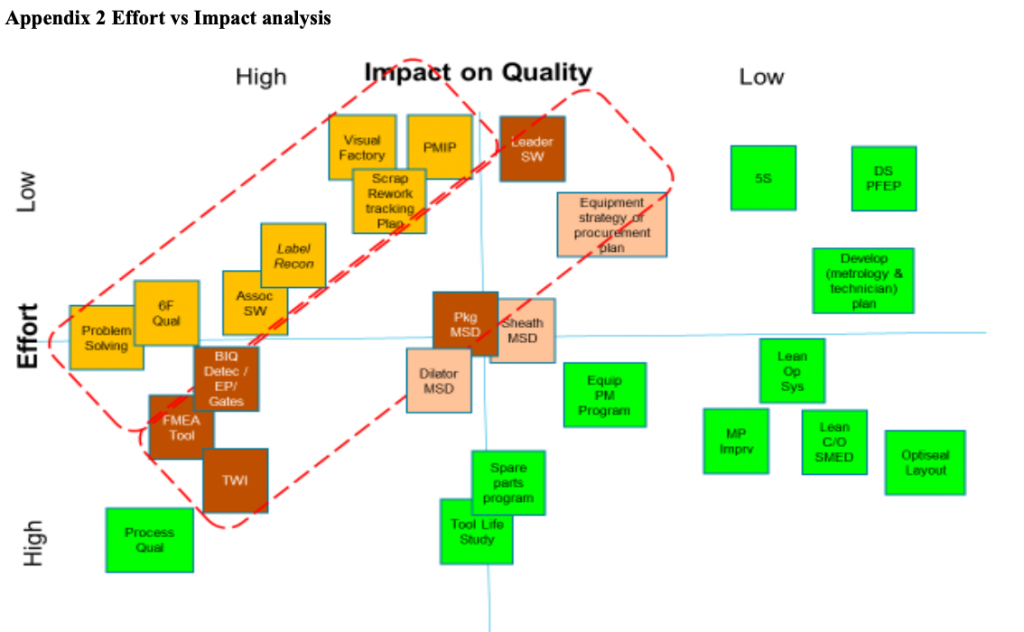
Day 1: Introduce Lean Diagnosis Concept Review Business Priorities Review Plymouth XXX value stream Performance Metrics Go through Lean Principles 1 & 2 (Floor Exercises and group discoveries) Day 2: Go through Principles 3, 4 & 5 (Floor Exercises and group discoveries) Day 3: Complete Symptoms, Data, Diagnosis & Treatment options Establish value stream business priority Go through the effort vs impact exercise Create Treatment Plan |
|
Post- Diagnosis Work |
Finalize Transformation plan |
Results & Final Conditions:
Prioritized project list below:

Sustainment
- Weekly A3 will be used to track projects on the Transformation Gantt chart to help us know if we are on or off track
- Production Monitoring and Improvement Process (PMIP) chart have been deployed at the workstation and cell levels to make the value stream
metrics visible.
- Cross functional team consisting of process owners have been engaged in identifying and solving problems.
Conclusions/Lessons Learned
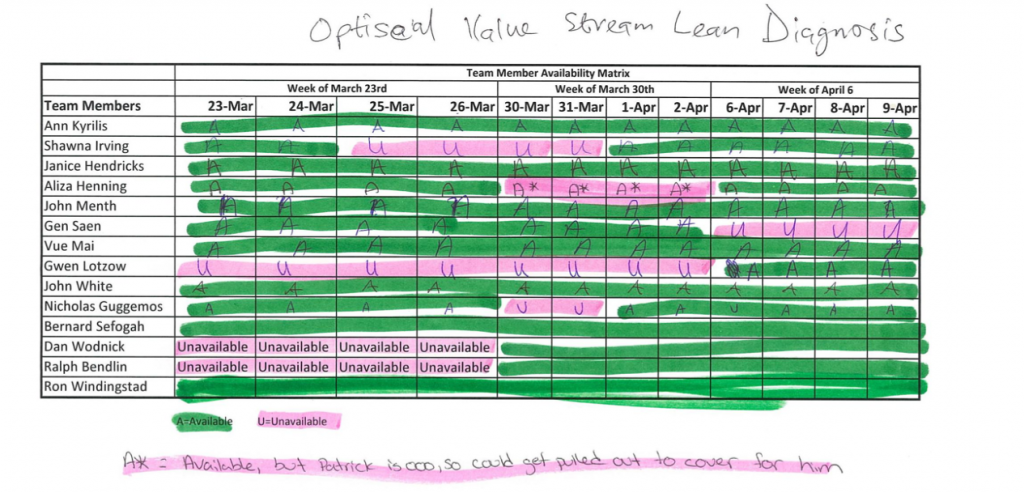
- Scheduling – It was initially challenging to find dates where all team members were available. I used Team member availability matrix (Appendix 1) to overcome this.
- The PDCA cycle – The planning phase require significant input and if done right, makes the rest of the phases easier. The cyclical nature of PDCA helps sustains gains in each iteration.
- ‘Go See’ – The data collected about processes are easier to relate to if one goes to the point of occurrence and take a closer look or review videos of the process. Quantifying current and future conditions become more meaningful.
- Alignment – Group discoveries from undertaking floor exercise together enhances alignment on why and how problems should be solved.
Appendix 1 Team member availability matrix


